Usage report
Overview
The usage report is for organization admins, Journey Ops leads and CX managers who want to see how their teams use TheyDo. It shows who is active, how journey work is growing across workspaces, and how much your teams rely on AI, so you can prove the value of journey management and spot teams that need support.
Who can see the usage report
The usage report is available to people with the permission to manage the organization (Organization Admins have it by default). It's included in Strategic plans and turned on per organization, on-demand. If you don't see it in your settings, contact your Customer Success Manager.
Open the usage report
- Go to
Settings. - In the organization section of the sidebar, click
Usage Report. - Wait a few seconds for the report to load.
Using Safari? The first time you open the report, Safari asks for permission to load it. Click
Allow access, thenBack, thenAllow accessagain.
What's in the report
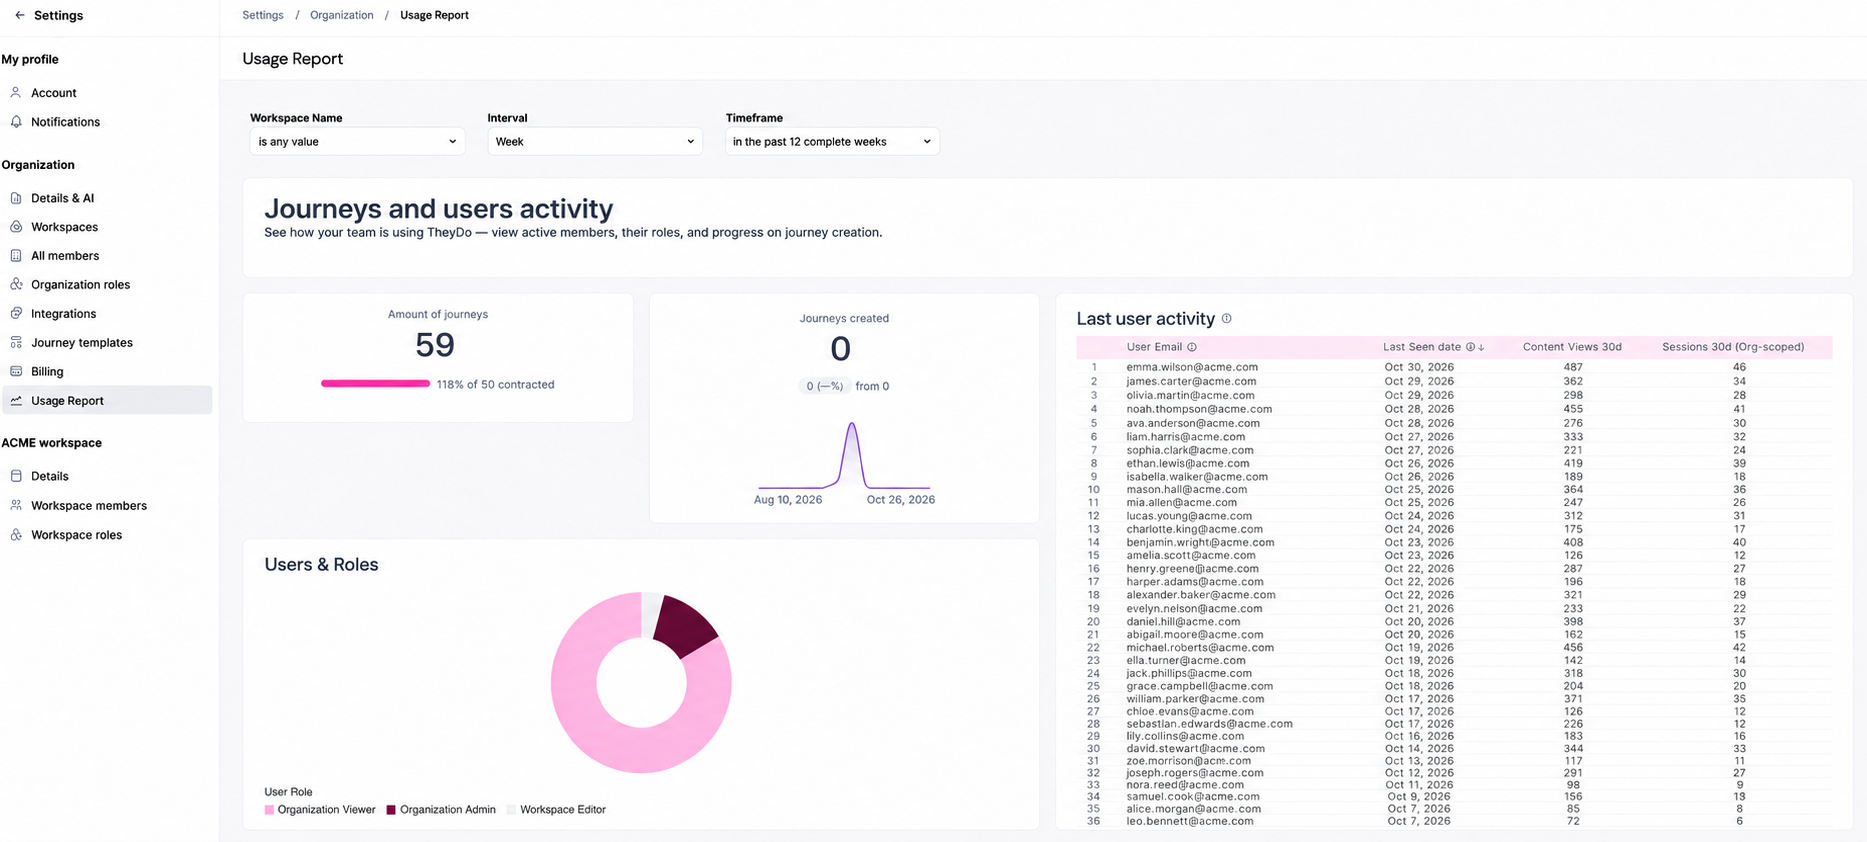
Journey activity
Follow how many journeys your teams create and update over time, and how journey work spreads across workspaces. Use it to compare journeys created against what you planned, or to see whether a few workspaces carry most of the work.
Active users and engagement
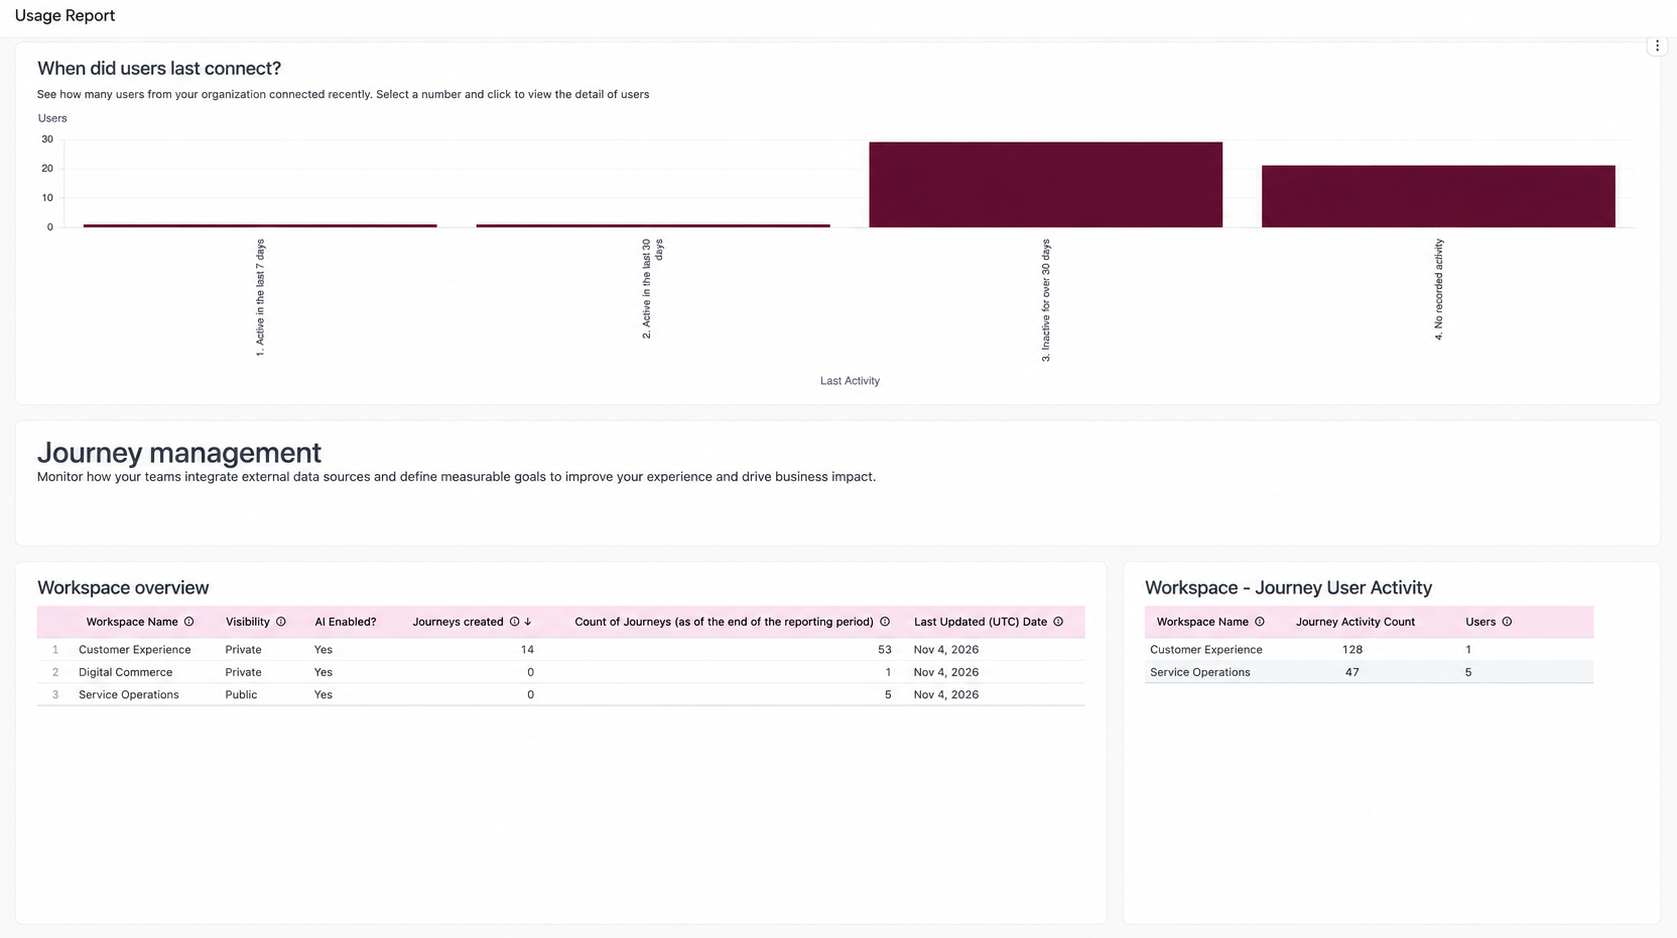
See who uses TheyDo and how often. This section shows active users over time, how often people come back and how long they stay (session frequency and length), which content they engage with, and when each person was last active. Use it to find people to re-engage or to onboard again.
Users and roles
Break down your members by role and workspace to understand who contributes and how. Click a role in the chart to see the list of people behind it.
Workspaces
Review each workspace at a glance: number of journeys, when they were last updated, their visibility, and how much AI is used in them.
Goals and integrations
Track how many goals your teams set and which integrations are connected, to see where TheyDo is linked to your wider data and business outcomes.
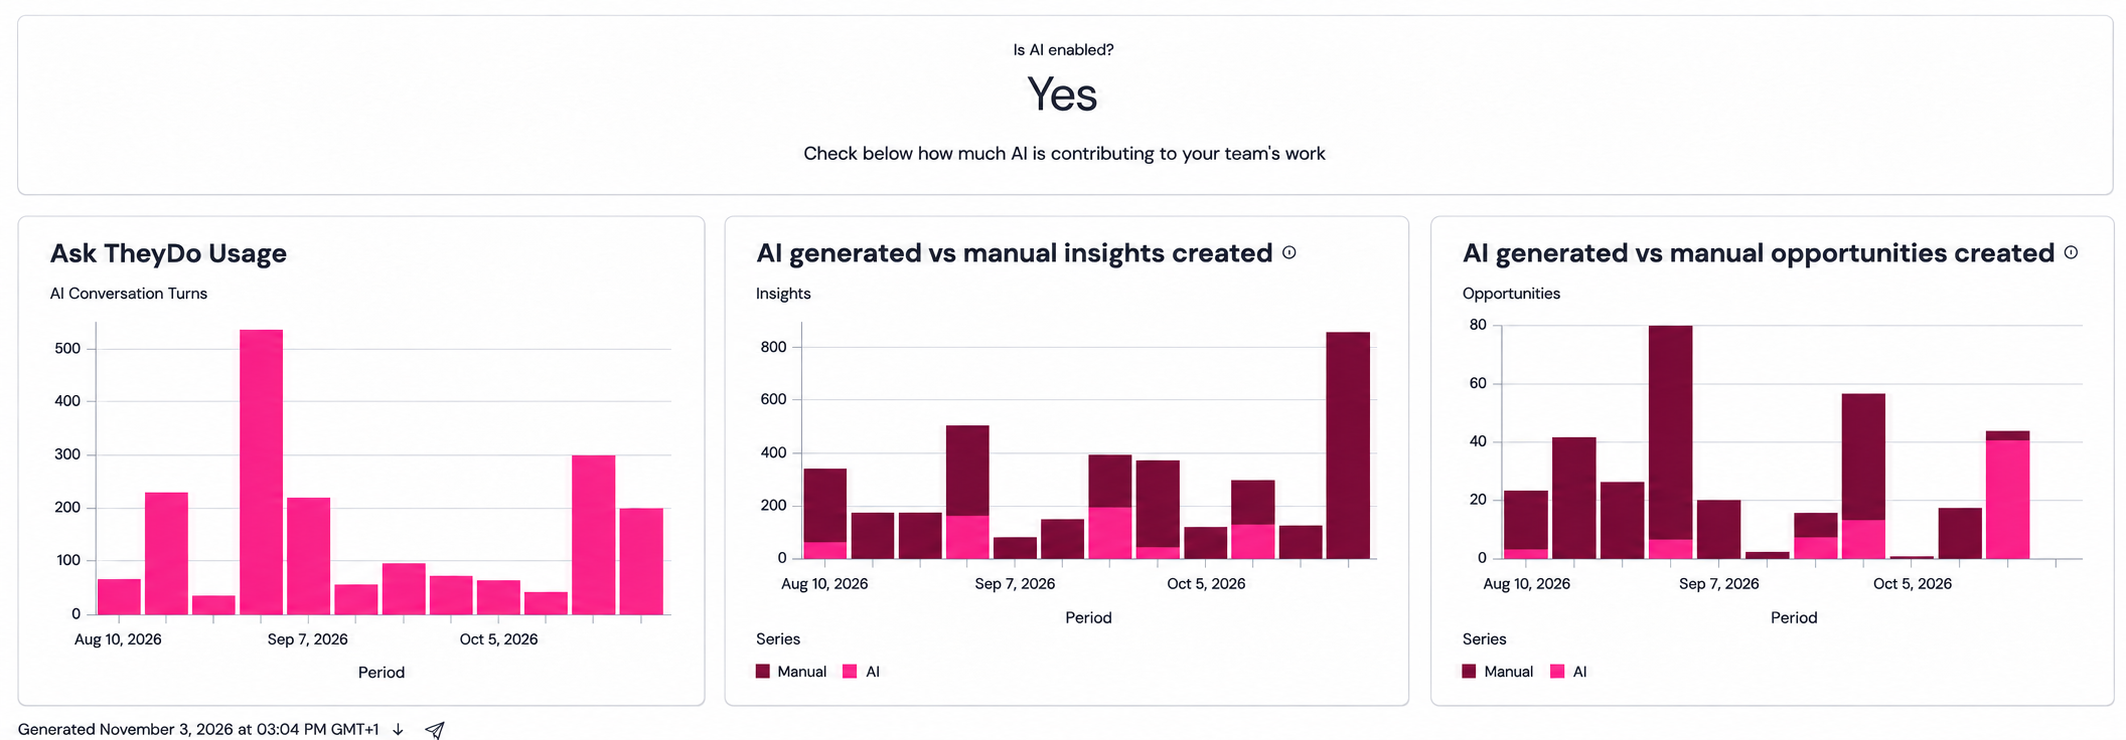
AI adoption
Compare insights created manually with insights generated by AI, and see how much your teams use the TheyDo Agent (number of AI interactions and people using AI). Only counts are shown: the content of prompts is never included in the report.
Filter, export and schedule
Most charts can be filtered by time period and by workspace. By default, the report covers the last 12 weeks.
Each chart can also be downloaded or sent on a schedule, which is useful for a monthly adoption update to your leadership team:
- Hover over the chart you want to share.
- Open the chart's menu.
- Choose to download it, or to schedule a recurring delivery by email.
You can also use download and schedule options at the bottom of the dashboard.
Good to know
The report is read-only: nothing you do in it changes your workspaces or members. Data is refreshed daily, so today's activity may not show until tomorrow.