How different data are managed in TheyDo
TheyDo holds more than one kind of data, and they are managed in different places by different people. Raw research material behaves differently from an insight, a metric data point behaves differently again, and all of them behave differently from the tags used to classify them. This article explains the layers, so you know where a given piece of data lives and which part of this section to read next.
The layers, from raw to decision-ready
Think of your data in five layers. Each one is built on the layers beneath it.
- Raw evidence. The interviews, survey exports, support logs and feedback files you bring in. These live in the Data Hub as data sources.
- Quotes. The individual customer statements pulled out of that raw material, used as evidence on insights.
- Metric data. The numbers behind your KPIs, arriving as data points from a CSV file or from a connected warehouse or feedback platform.
- Building blocks. The interpreted records: insights, opportunities, solutions, metrics, goals and personas.
- Taxonomy. The classification layer that sits across everything: statuses, types, categories and tag groups.
The first three layers are the data itself: qualitative evidence enters through the Data Hub, quantitative data enters through metric import and connected pipelines. The fourth layer is covered in the Building Blocks section, starting with What are building blocks?. The fifth is managed in workspace settings.
Raw evidence: the Data Hub
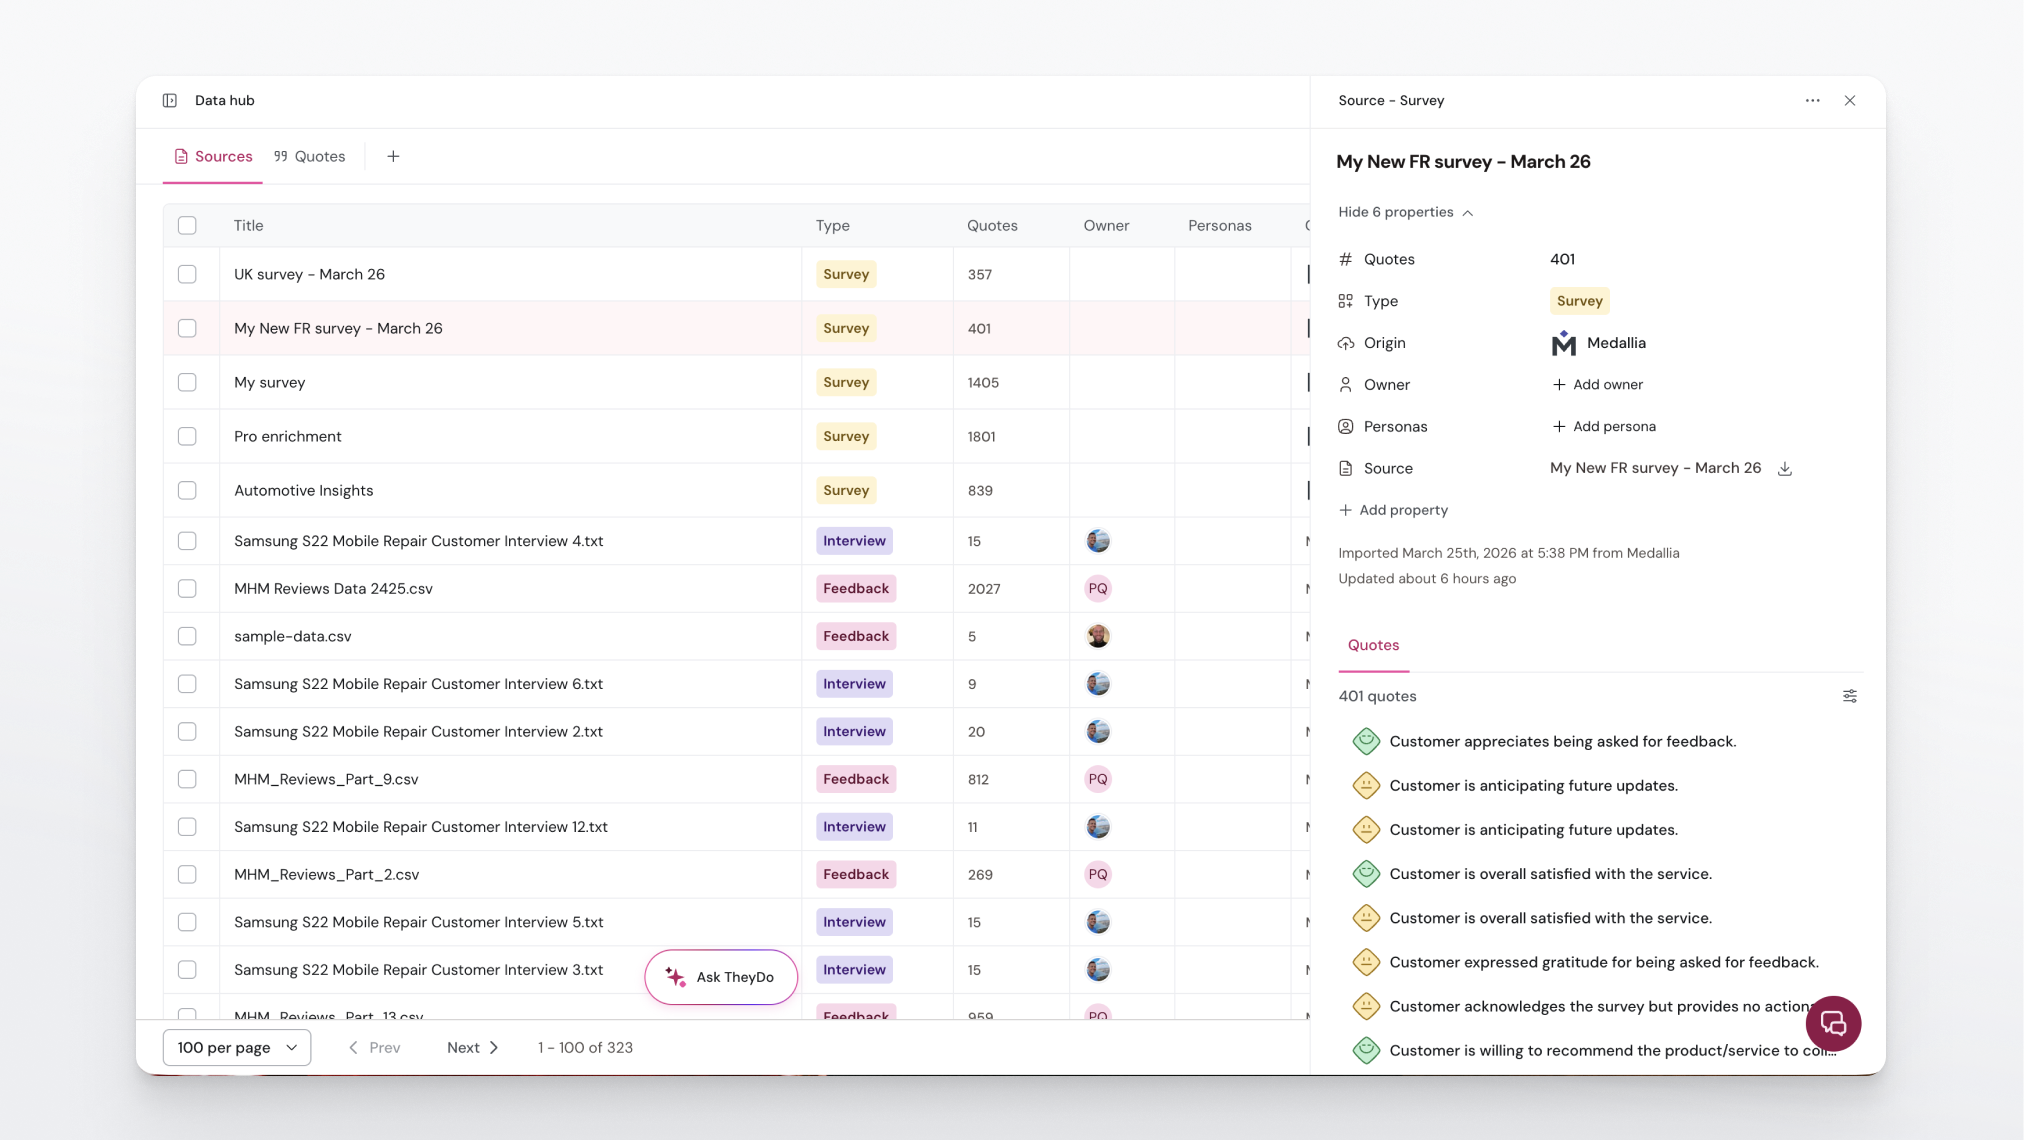
The Data Hub is where external evidence enters TheyDo. You upload files or connect a source system, and each data source carries a type (interview, survey, support log or feedback) and a processing status so you can see what is ready to work with.
Once a source is processed, AI mining can extract insights from it and place them on the journey steps they belong to. Mining is review-gated: nothing lands in your libraries until someone accepts it.
Start with What is the Data Hub?, then How to upload and manage data sources.
Quotes: keeping the customer's own words
Quotes are the verbatim evidence behind an insight. They keep the trail back to the source, so anyone reading an insight can check what a customer actually said. You can browse them across all your sources in the Quotes Library, or add one by hand when it comes from somewhere outside TheyDo.
See How to use the Quotes Library and How to create a quote manually.
Metric data: the numbers behind your KPIs
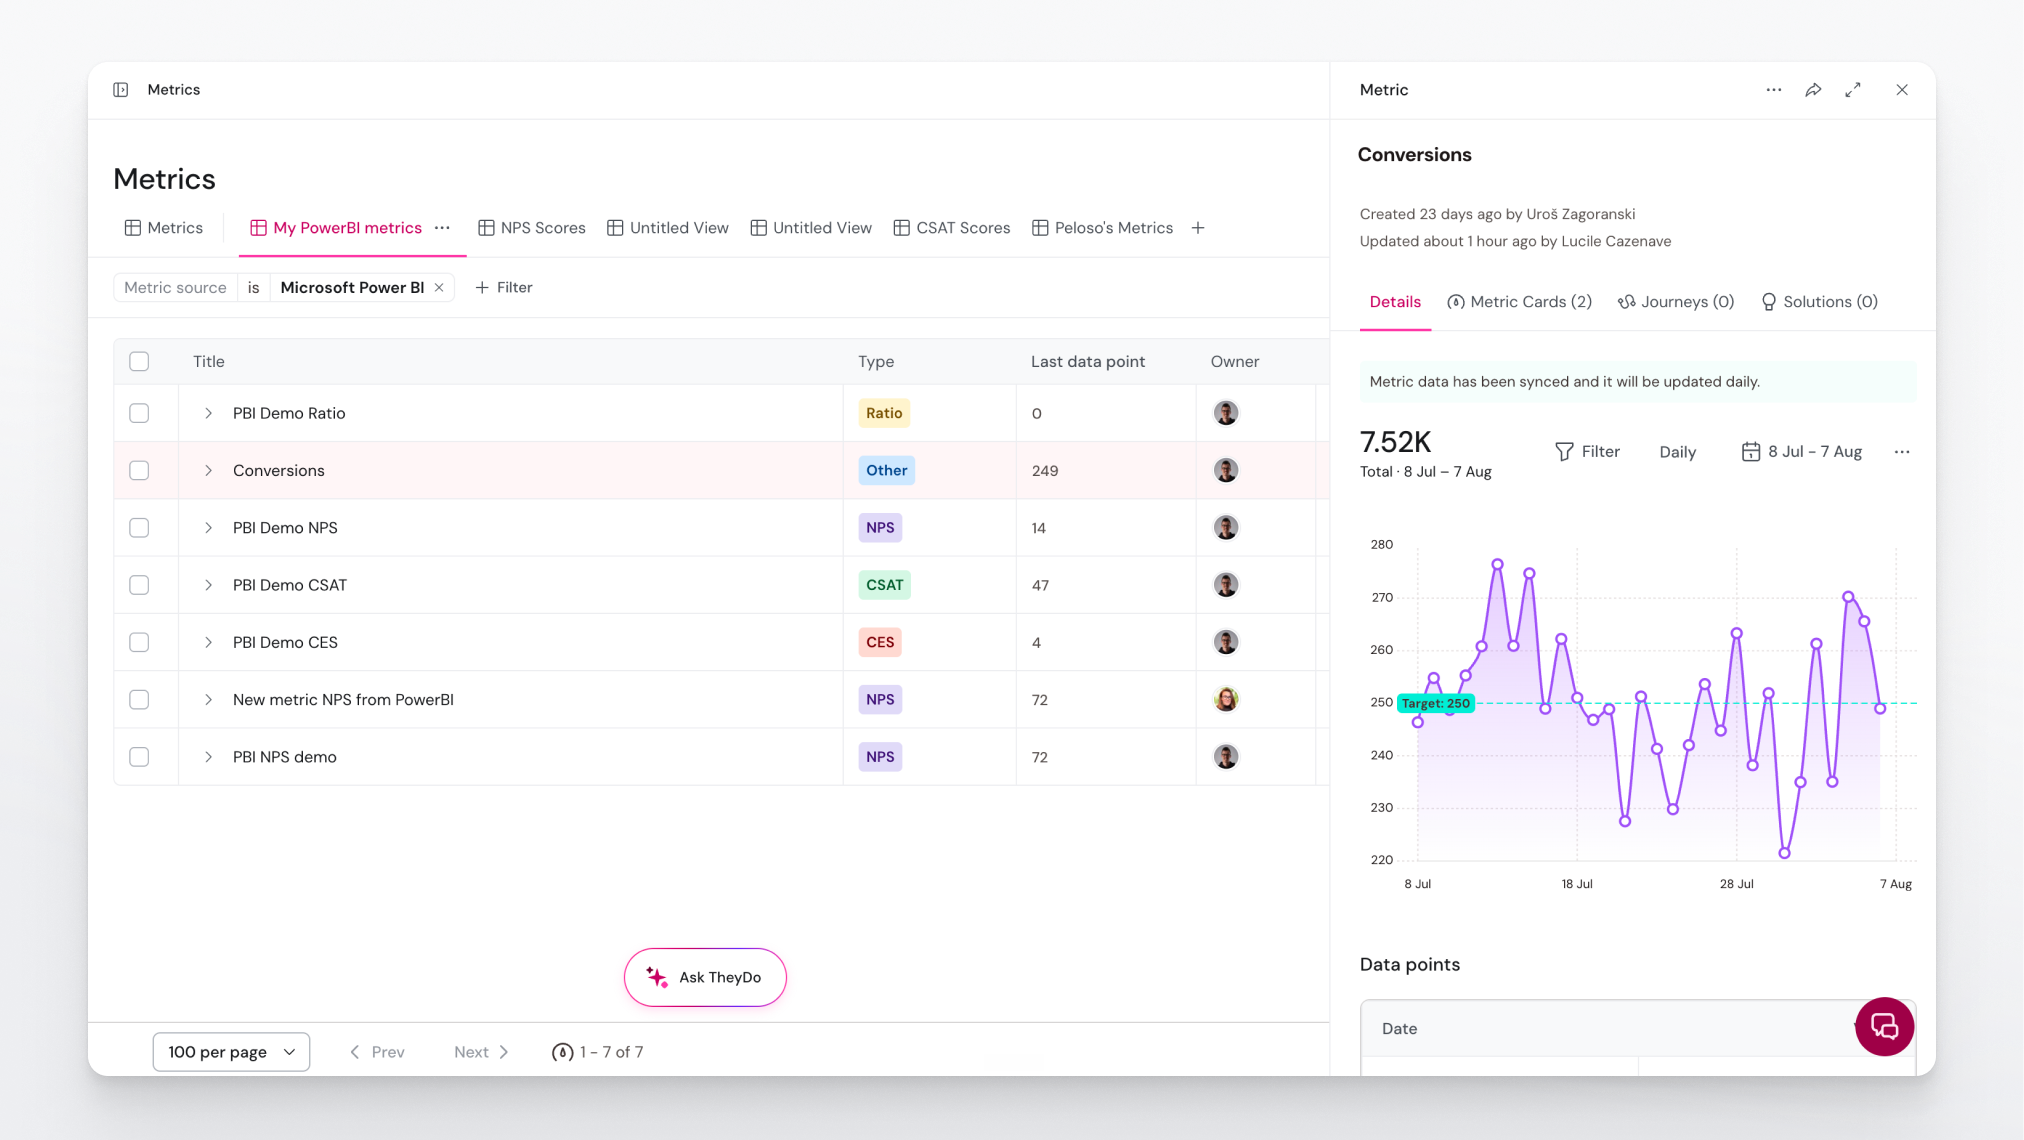
Qualitative evidence is only half the picture. The other half is quantitative: satisfaction scores, completion rates, handling times, volumes. In TheyDo, a metric is the definition of the KPI, and the data behind it is a series of data points, each one a value on a date.
There are two ways that data arrives.
By CSV import. Use this when the numbers live in a spreadsheet or a report someone runs by hand. The import runs as a three-step flow, started from the Import button in the metrics library or from the data points on a metric:
- Upload the file and pick the column that identifies each metric, so TheyDo knows which rows belong to which KPI.
- For each identifier found in the file, choose to link it to an existing metric, create a new metric, or skip it, then map the file's columns to that metric's data fields.
- Review the result per metric, and retry or upload another file if something failed.
Files are limited to 100,000 rows, so split very large extracts before importing.
By a connected pipeline. Use this when the numbers already live in a system of record: a data warehouse such as BigQuery, Snowflake or Databricks, or a feedback platform such as Qualtrics or Medallia. Once the integration is connected at organization level, data points sync into TheyDo on a schedule instead of being uploaded by hand.
Note: data points that arrive from a connected source are read-only in TheyDo. The source system stays the single point of truth, and TheyDo reflects it rather than holding a second version people can edit.
What TheyDo does with the numbers
Raw data points on their own are not much use in a journey. Two things turn them into something a team can read.
Dimensions are the breakdowns that come with your data: region, segment, channel, product line. They are what let one KPI answer more than one question, because you can look at the same metric for one region rather than for the whole business. See What are metric dimensions?
Metric cards are saved configurations of a metric: the chart settings, the interval, the timeframe and the dimension filters. A card pins down one reading of a KPI, for example EMEA, daily, last 14 days, without duplicating the metric itself. You can create several cards on one metric and place each where it belongs, either in a metrics lane at a specific step or in the row of metric cards above the journey.
That is the point of the whole chain: a number stops being a line in a dashboard and becomes a measurement of one moment in the customer experience, sitting next to the research that explains it.
Start with What is a metric?, then How to import metrics from a CSV file.
For the warehouse route, see the connector articles in Integrations, for example How to use Snowflake data in TheyDo, How to use BigQuery data in TheyDo or How to use Databricks data in TheyDo.
Taxonomy: the classification layer
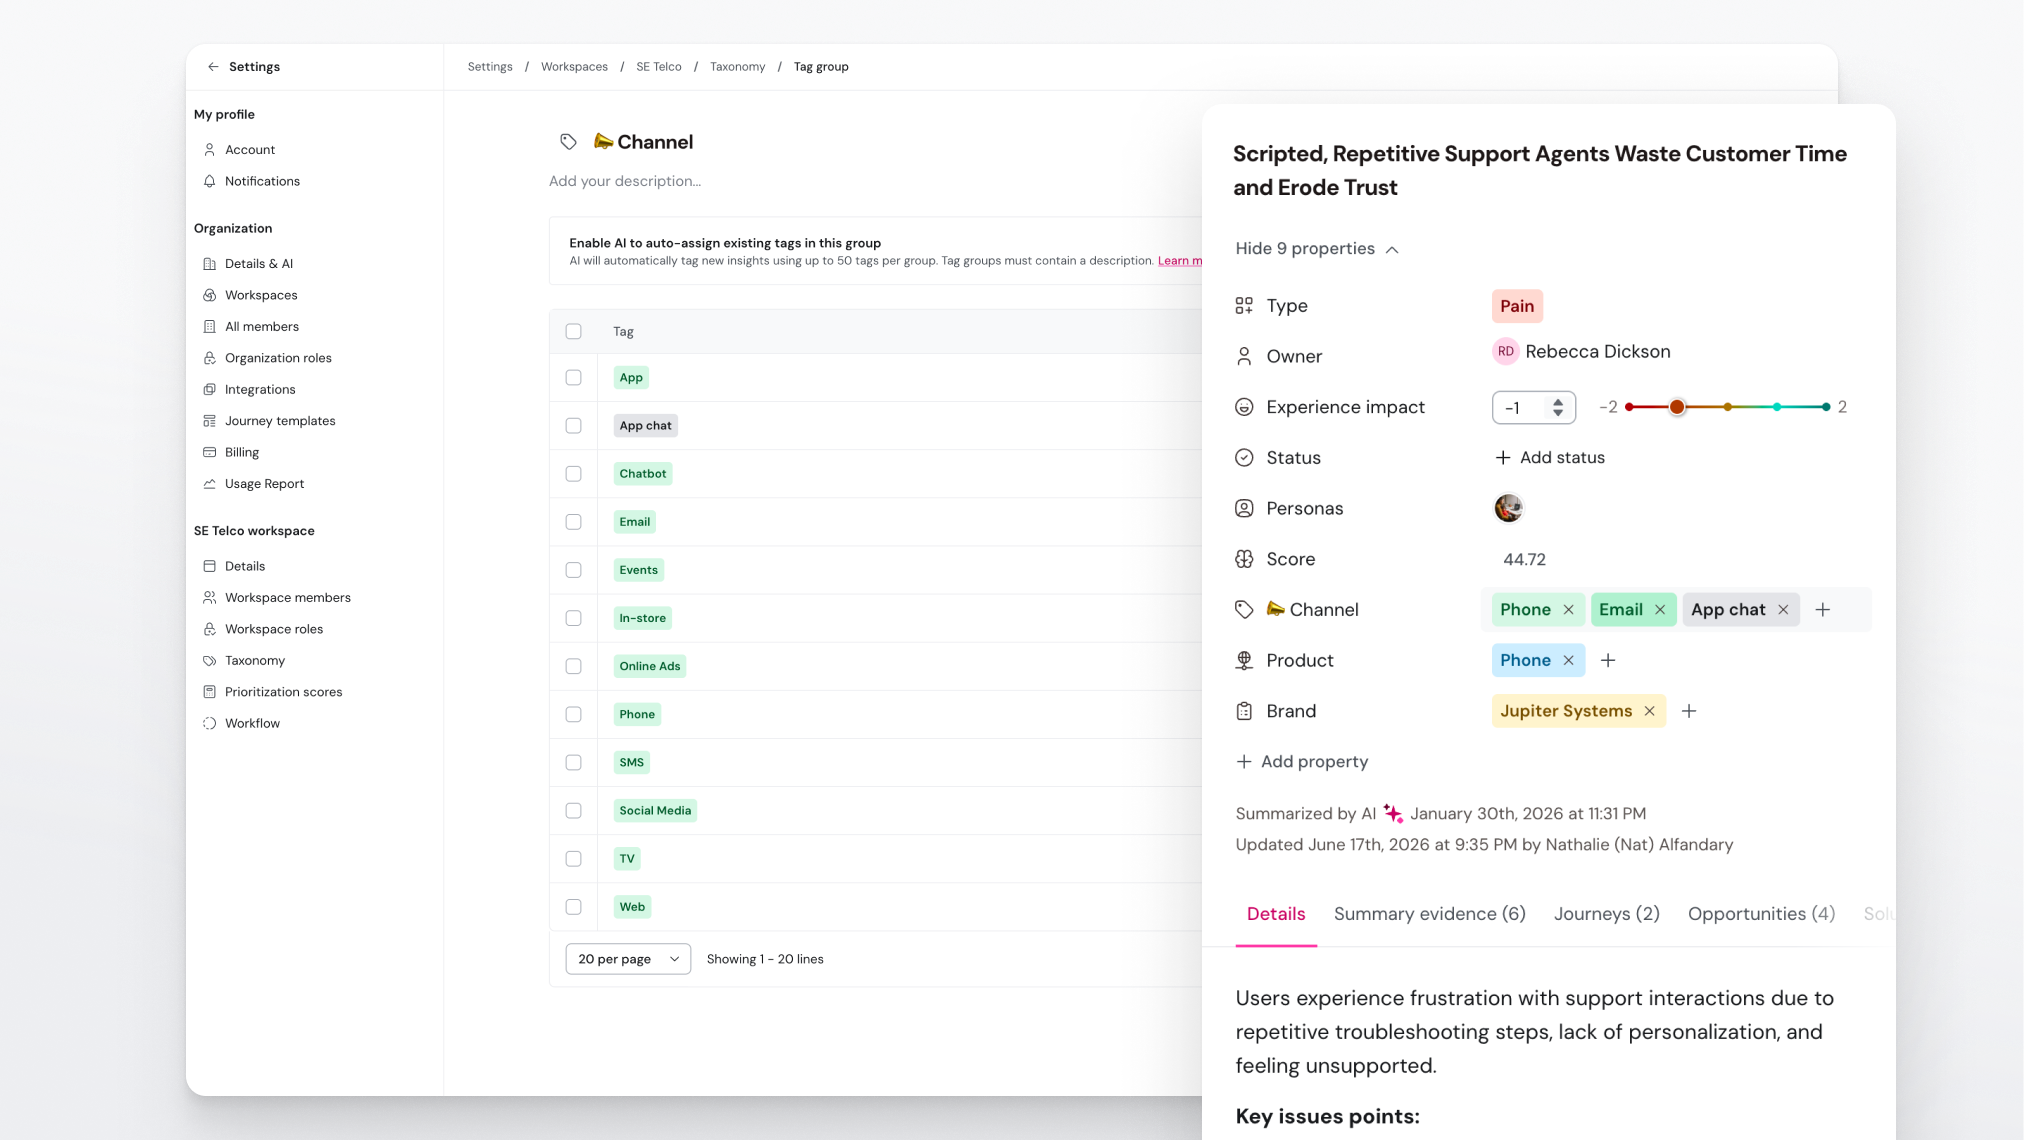
Taxonomy is how your workspace agrees on language. It is managed in Settings > Workspace > Taxonomy and covers:
- Statuses, grouped into workflow buckets, so progress means the same thing to everyone.
- Types and categories, so records of the same kind can be told apart.
- Tag groups, each with its own set of tags, which appear as properties on building blocks and as columns in library tables.
Because taxonomy definitions flow through filters, library columns, and AI matching, changing them affects everyone in the workspace. Editing requires taxonomy permission and a qualifying plan.
Start with What is a taxonomy?, then How to create and manage tags.
Tip: taxonomy is worth agreeing on early. Tags added ad hoc by different teams are the most common reason a workspace becomes hard to filter later. If you want the fuller version of that argument, read Data governance for AI: preparing your organization to scale.
Getting data in and out
Not everything arrives through the Data Hub or a metric pipeline, and not everything stays in TheyDo. The Import & Export sub section covers the routes in and out: bringing in building blocks from CSV files, exporting a journey to share outside the platform, exporting a library as CSV, and delivering data automatically over SFTP.
Start with How to export data.
Data across workspaces
Larger organizations run several workspaces, often one per team, market or business unit. Cross-Workspace Data covers what happens when content moves between them, including duplicating a whole workspace to use as a template and what comes along when you duplicate a journey.
See How to duplicate a workspace.
Retiring data: archiving
Data does not stay relevant forever. Archiving takes a record out of everyday views without deleting it, so your libraries stay current and the history stays intact. See What is archiving?.
Where to start
Read What is the Data Hub? first. It is where most data enters TheyDo, and the rest of this section makes more sense once you have seen how a source becomes an insight. If your first job is getting numbers in rather than research, start with What is a metric? instead.