New research: 1,000 enterprise leaders on the AI decision-confidence gap.
Stop pitching priorities.
Start proving why
Customer pain × business impact, on one ranked list.
Product, CX, and design ship from the same evidence.
:format(webp))












Every team is right. None are looking at the same picture
CX has the holistic view of the journeys and the data across departments. But none of it speaks the language the business runs on.
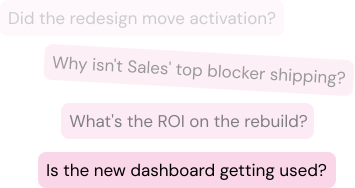
Questions your roadmap doc can't answer
Spreadsheets and scoring models can't tell the chain. The loudest voice in the room with a fancy deck wins. But the next bet has to be defensible.

From the loudest voice to the strongest evidence
TheyDo gives product teams the unified picture they need to prioritize what ships next.
:format(webp))
Customer pain
:format(webp))
Business impact
Loading testimonial...
:format(webp))
Opportunity-solution orientation

How product and CX operate better together
TheyDo Agent groups customer pain points by theme - each one backed by the actual customer quotes that surfaced it.
Product teams already prioritizing this way
Loading testimonials...
Ready to prove the why?
4,000+
hours saved
36%
efficiency lift
5x
time to value
90%
shorter time-to-decision
Frequently Asked Questions
How do product teams decide what to build next from customer evidence
TheyDo combines customer pain with business impact in one ranked list. Pain points cluster by theme, attach to the journey Phase + Step where they appear, and connect to the metric they move. The result is a prioritized list - not a stack of competing decks.
How does TheyDo help align product, CX, and design on the same priorities?
By putting all three teams in front of the same Collection. Product sees what customers struggle with. CX sees how it shows up in the journey. Design sees where the friction lives. One list, three lenses, one decision.
How is this different from RICE, MoSCoW, or other prioritization frameworks?
Those frameworks are scoring methods. TheyDo gives them the inputs they need to work. Most teams have a framework; what they lack is shared evidence underneath it. TheyDo provides that evidence - pain attached to journey Steps, business impact attached to the same coordinates, scored together.
When should product teams use TheyDo for prioritization?
Quarterly roadmap planning. Sprint prioritization when teams compete for capacity. New product and feature investment review. Anywhere multiple teams need to agree on what to build next.
Can TheyDo scale this across multiple product teams?
Yes. Collections give each team a scoped view of the ranked list relevant to their area. The evidence stays consistent; the view adapts to who's looking at it. Larger organizations run the same approach across multiple business units.
Can TheyDo show evidence behind a "don't build" decision too?
Yes - and that's often the more valuable answer. Lufthansa saved millions in R&D by realizing a problem they were about to invest in wasn't theirs to fix. The workflow that ranks opportunities up the list also tells you when something doesn't belong on it.