How to use Pulse view in Data Hub
Pulse view gives you a visual overview of what's in your Data Hub, without scrolling through a long list of quotes. Instead of a table, you get three widgets that summarize your data by tag, sentiment, and trend. You can click into any segment to explore the underlying quotes or create a saved view from that slice.
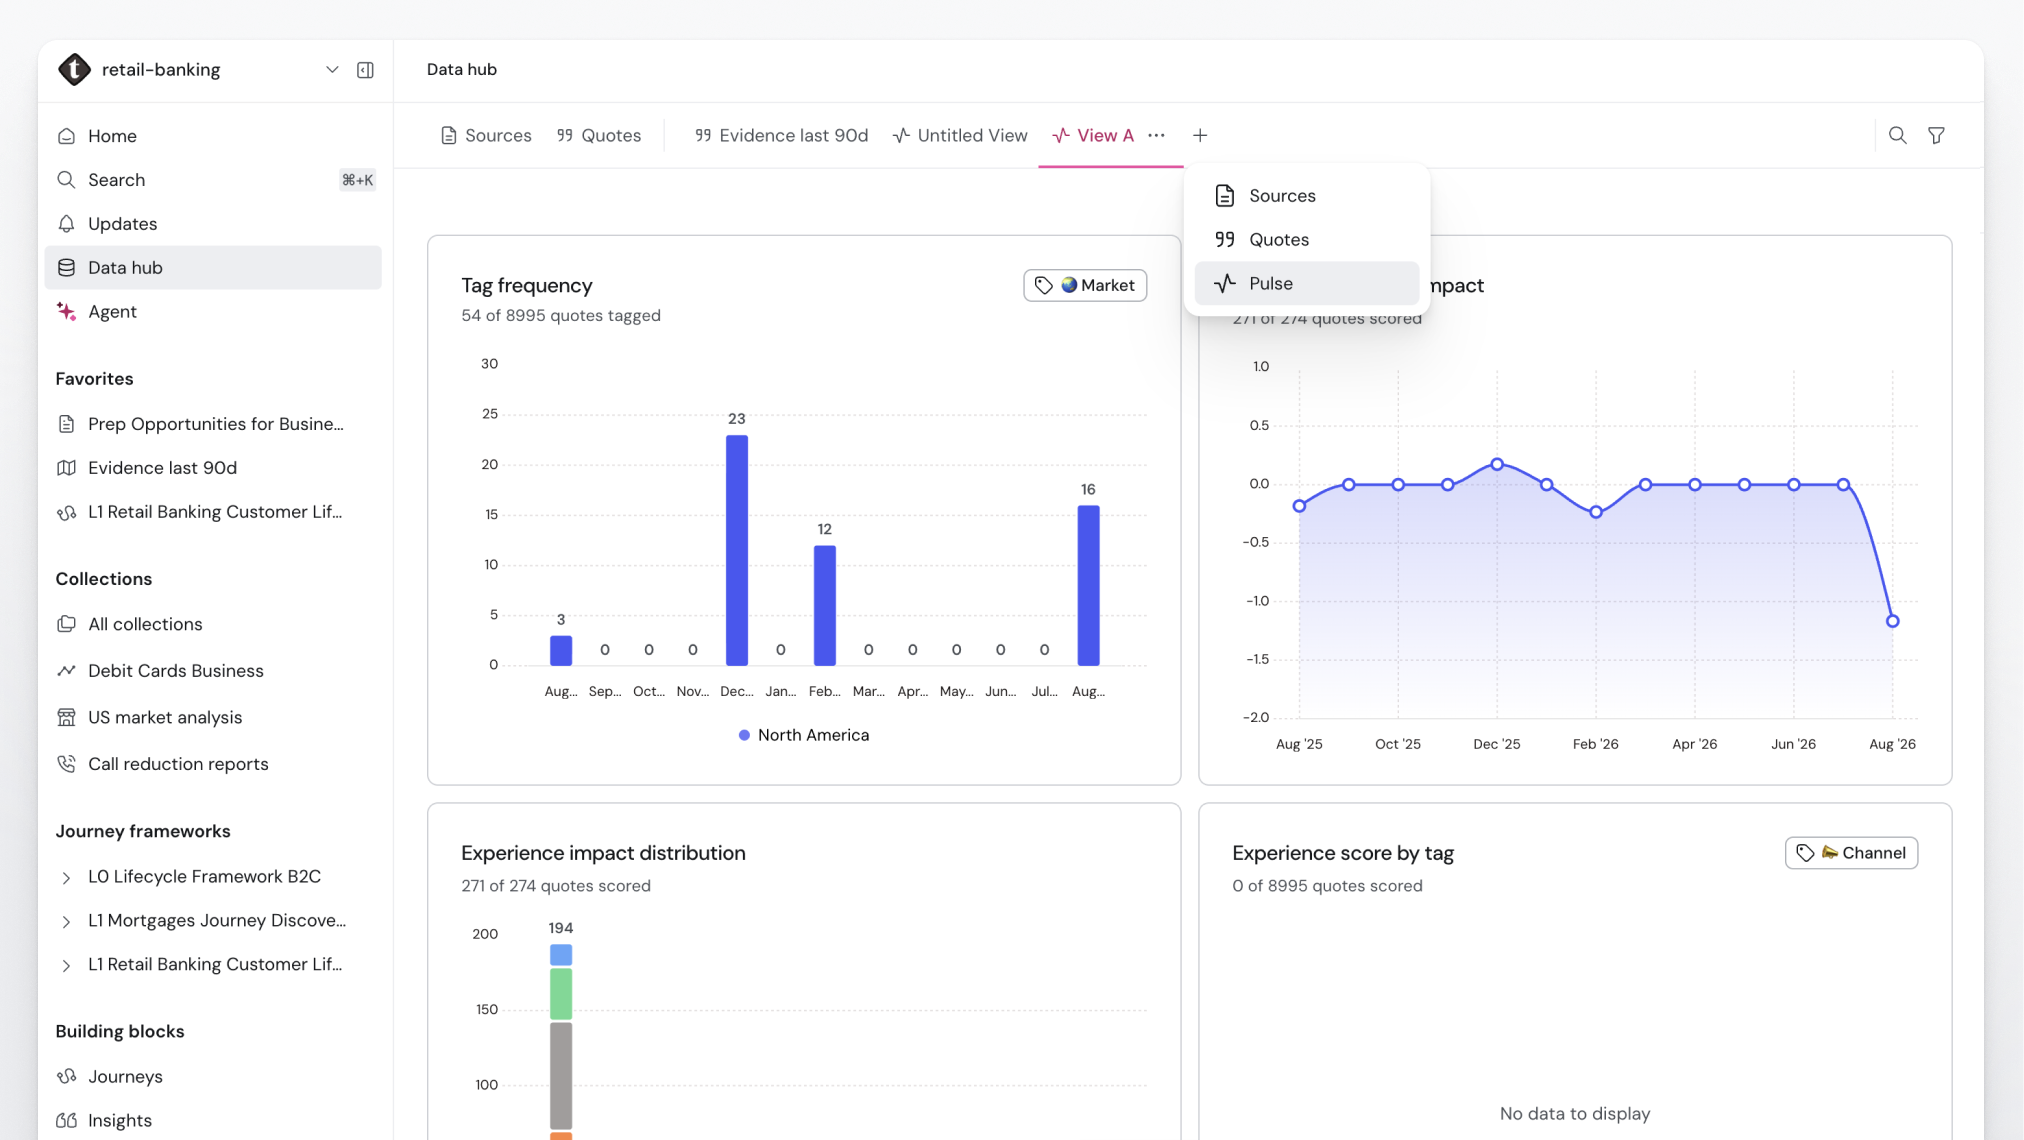
Open Pulse view
- Go to Data Hub.
- Open an existing saved view, or create a new one.
- Select Pulse from the view layout options.
What you'll see
Tag frequency
Shows how quotes are distributed across a tag group. Switch between tag groups to explore different segments. For example, by turnover, in-flight, or post-flight. It also shows what percentage of quotes in your dataset have a tag for the selected group, which gives you a quick signal on data quality.
Average experience impact over time
A trend line showing how positively or negatively quotes are perceived over time. Use this to see whether sentiment is improving or declining across a data source.
Experience impact distribution
A bar chart showing how many quotes fall into each sentiment bucket from very positive to very negative.
Explore quotes from a widget
- Click any bar or segment in a widget.
- A sidebar opens with the matching quotes, pre-filtered to that segment.
- From there you can:
- Review and tag quotes
- Add more filters
- Select Create view to save that filtered set as a saved view
- Run Ask TheyDo on the saved view for further analysis
Tips
- Pulse view works with all existing saved view functionality: you can save, update, and favorite Pulse views just like any other view.
- Pulse view is optimized for large datasets and handles 50,000+ quotes at a time.
- Pulse views for other building block libraries (insights, opportunities, solutions, and goals) are coming soon.